.
Author: Shubham siddhpuria
Equity Dilution V/S EPS Dilution
In this blog we will talk regarding Equity Dilution and EPS Dilution.
Many people have confusion and are not able to differentiate between Equity and EPS dilution so in this blog we will look at both these terms properly.
First let’s talk about Equity Dilution…
So first of all, what is equity dilution???
Equity dilution is the dilution in the existing shareholding pattern of a shareholder in the company whenever the company brings or issues new equity shares in the market.
Now it is not necessary that the shareholder’s holding in the company will get diluted whenever the company brings new issue. It can get diluted in two scenarios.
But first, before discussing about those two scenarios, we will discuss about scenario when the shareholding of a shareholder in a company will not get diluted.
In total, we will be seeing 3 scenarios,
1) Existing shareholders participate in new equity issue in same proportion.(NO DILUTION)
2) Existing shareholder participate in new equity issue but not in same proportion.(DILUTION)
3) Existing shareholder does not participate in new equity issue and a new person participates.(DILUTION)
So, lets understand scenario 1(DILUTION) with the help of an example…
Assume there are two shareholders in a company A and B. Both have 50% each holding in the company comprising of 100 shares each, total shares in the company is 200.
Now suppose the company sees a growth opportunity and it wants to expand and for that it needs to buy assets for that purpose. Now for that the company needs to arrange capital for that,
It can arrange capital either from borrowing or by issuing fresh equities in the market.
Here we will assume that the company has gone for fresh equity issue option.
Now, For example let’s say company issues 600 new equity shares in the market.
In scenario 1,
Both A and B purchases 300 equity shares each. Therefore now both of them holds 400-400 shares in the company which is again 50-50% holding in the company.
Therefore in the scenario both A and B have same % of shareholding in the company even after the fresh equity issue, hence in this case there is no dilution of equity in the company.
Now let’s discuss the two scenarios which will lead to equity dilution in the company.
Scenario 2 – Existing shareholders participate in the new equity issue but does not participate in the same proportion of their existing shareholding pattern.
Scenario 3 – Existing shareholder does not participate in the new equity issue and a third person enters the shareholder’s list by purchasing those new equity shares.
In these two scenarios (2 and 3) also we will assume the same example we took in the non-dilution case that A and B holds 100 shares each, total shares in company 200.
Company issues 600 new equity shares in the market.
Let’s discuss scenario 2
A holds 100 shares – 50%
B holds 100 shares – 50%
After the issue, let’s assume A buys 400 shares and B buys 200 shares.
Now,
A holds 500 shares – 62.5%
B holds 300 shares – 37.5%
Now this case has led to equity dilution for B but equity appreciation for A because he bought more shares as compared to B.
Scenario – 3 (A and B does not participate and new person C participates)
Before issue,
A holds 100 shares – 50%
B holds 100 shares – 50%
After the issue, A and B does not participate and C buys all 600 shares in the company.
A holds 100 shares – 12.5%
B holds 100 shares – 12.5%
C holds 600 shares – 75%
As you can see in the example, after the issue, holding of A and B has come down to 12.5% each from 50% holding. This has led to equity dilution for both of them.
Now let’s talk about EPS DILUTION.
First let’s discuss EPS!
So…
What is EPS?
EPS is called Earning per share.
In simple words…it can be explained like how much a shareholder is earning on his/her 1 share.
EPS is calculated by dividing EAES (Earning available to equity shareholders) divided by total number of shares.
Now what could all be the reasons that can lead to EPS dilution in a Company?
There can be 2 reasons according to me…
1) Revenue and net profits of the company decreases and total number of equity shares in the company remains same.
2) Revenue and profits of the company remains constant but total no. of shares increases in the company.
It is very necessary for a company to plan its future operations if they are going to raise their equity by introducing more equity shares in the market for their operation because the result of this can impact their EPS in any manner positive or negative depending on the results of their operations.
If they are able to successfully capitalize their new equity by earning doing more revenue and earning higher profits than before then the EPS of the company would increase but if they are not able to capitalize their new issue and there is very less or no impact on their revenue or profits then their EPS will decrease as now there are more no. of shares in the market will the same net profits.
There can be cases where there is dilution of equity but appreciation of EPS. How???
Assume our scenario 2 or 3 of equity dilution happens and company gets wonderful results from it which led to increase in net profits of the company then that would let to dilution of equity for A and B but increase in net profits for them.
There can also be a case that there is no equity dilution but there is dilution of EPS. How again???
Take our Scenario 1 of equity dilution here.
Both A and B participate in new equity issue in same proportion but the company fails to capitalize it and therefore is not able to earn higher profits as compared to previous years. Here there will not be equity dilution for A and B but there will be EPS dilution as profits are the same but no. of shares has been increased.
If we talk about scenario 3 of equity dilution where C buys all the newly issued equity shares,
If he buys those share at a higher price as compared to the price which it should have been bought for(as per the valuation) so he will get less EPS as compared to A and B who might have bought shares at a lower price.
So it is very necessary for an investor to do proper valuation of the company before investing in it.
EPS dilution of a company is majorly depended on a ratio known as ROIIC (Return on incremental invested capital). This ratio shows that how much return a company is able to successfully generate on the additional capital which it has put in.
If you want to know more about ROIIC then you can refer our previous blog where we have explained financial ratios.
We hope that after reading our blog you are able to properly differentiate between Equity dilution and EPS dilution.
Operating Leverage
Operating leverage is a measure of how revenue growth translates into profit. Revenue is directly translated into profit because of high fixed cost. Generally asset heavy companies have an effect of operating leverage. Asset heavy industries are the industries which have lesser asset turnover (Ratio).
How revenue is directly translated into profit by fixed cost let us understand:
First of all this doesn’t means that company doesn’t have variable cost or if the revenue is increasing the variable cost is not increasing. This statement means that the company has major cost as fixed cost (fixed cost are constant no matter how much sales/revenue company is generating). In such cases, any increase or decrease in the revenues will (partially but directly) flow to the bottom line (in the form of profit or loss). Now let us understand the following with the help of numbers.
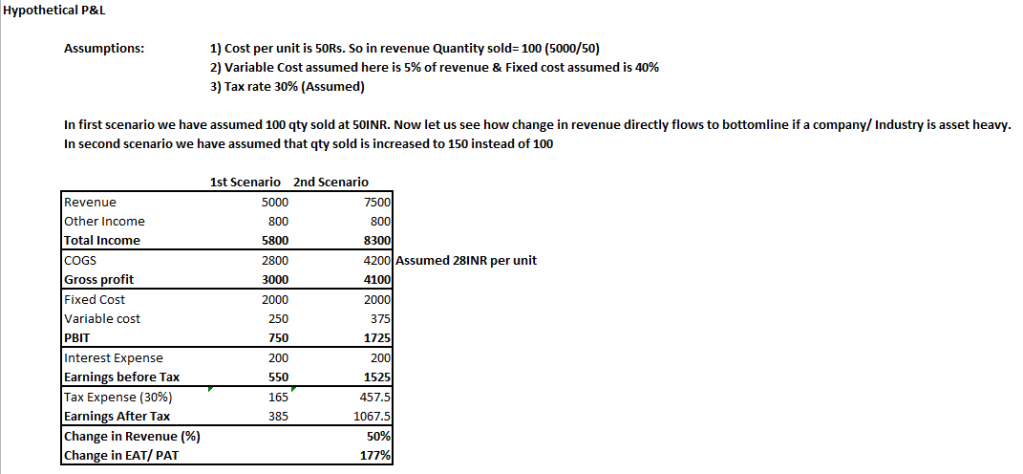
What happened in the above example?
A 50% hike in a revenue brought 177% increase in PAT. This is because “The revenue(% wise) is increasing faster than cost (% wise). Overall cost is increasing but at lower pace than the revenue”. This was the good scenario where we expected that company sales will grow by 50% but what if company’s revenue declines? Now let us see an example for the same.
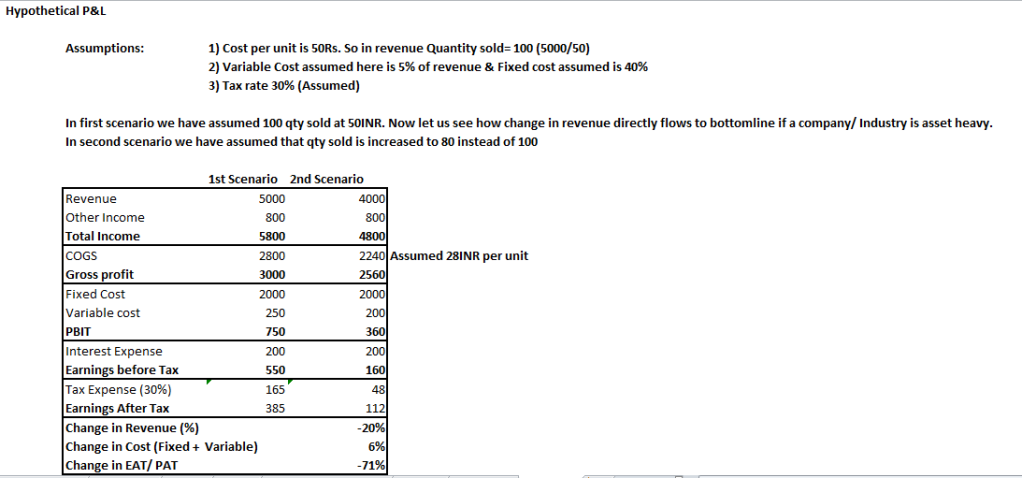
Due to which factor/ Component this thing is happening let us understand it.
This is happening because company is not able to reduce it’s cost. Revenue is decreasing but cost isn’t that’s why people quote that Operating leverage is double edge sword. .
Things to remember:
- As an investor point of view you need to have an good grip on industry because if you that company (operating leverage one at peak) then you will lose your money.
- Companies having huge fixed costs (generally, asset heavy companies) enjoys the benefits of operating leverage. However, one needs to also focus on the downside of the operating leverage.
Book summary Part-2
ANALYSING A COMPANY.
In this author has given 5 steps to analyse a company.
1) Growth :-
It is very important component to check whether a company is a good company or a bad company. We as an investor mostly wants to invest in a company which has good growth but we forget that good growth attracts competition and hence introduces new competitors which then ultimately take out some piece of company’s profit. But this is something which promoters and management also knows thats why it is necessary to check if the company has good growth then what is the source of that growth, where it is coming from…
We want quality growth and not that growth which comes from cost cutting and accounting tricks.
The author has shown 4 sources of quality growth :-
i) Selling more goods and services as compared to its competitors.(high turnover)
ii) Raising prices of your product if you offer quality premium product and consumers are ready to pay that premium for that kind of quality. This will increase company’s profit margins.
iii) Selling new goods and services by regularly investing in R&D and bringing new innovative products in the market.
iv) Buying another company. Now here a investor needs to be aware that if a company is doing an aquisition then what type of acquisition is that? Some companies do acquisition just for the sake to increase its scale. That would give company a growth but that would not be a healthy growth. A good acquisition is when a company acquire a company which is doing good in its business.
Growth can be shown by a company by manipulating its financial statements which we call using accounting tricks. You as an investor needs to be very careful about it. You need to dig into numbers whenever you find anything suspicious in the numbers.
2) Profitability :-
(How much a company is generating profit from its capital investing)
We need to see what is the source of generating profits of a company. Is it by costing cutting of good or by price hiking or charging a premium for their goods.
Analyzing profitablity is very important for an investor but having a look at the company’s capital structure is also very important. We can analyse a capital structure of a company with the help of following ratios :-
i) Return on Assets (ROA)
Return on assets can be found out by multiplying net profit margins with asset turnover. It shows how much profit a company is earning per dollar of asset. Higher the ROA higher the efficiency of a company.
ii) Return on Equity (ROE)
Return on equity can be found out by (net margins × asset turnover × financial leverage).
This ratio shows how much a company is earning on its shareholder’s equity. Return on equity is good when it comes out from higher net margins and higher asset turnover. It can also be increased by increasing more financial leverage and decreasing its equity through buy back but that would make a company risky.
iii) free cashflow
Free cashflow is CFO(Cashflow from operations) less capital expenditure. It is the cashflow which belongs to the equity shareholder, the excess cashflow available in business. A company with higher or excess free cashflow does not have to depend on leverage for expansion. They can also buyback shares with the excess cash.
iv) Return on invested capital (ROIC)
It is also a better profitabilty ratio as compared to ROE. It takes only income from core operations and core assets into consideration. For example any assets which belongs to any non core activity for example investments are removed from total assets.
It assumes debt interest as equity only therefore there is no interest to be deducted from EBIT. Formula of ROIC is EBIT(1-t)/total core assets.
3) Financial Health :-
Financial health of a company can be analyzed through its financial leverage ratio. Financial leverage shows how much debt the company has in its balance sheet. Higher financial leverage can be troublesome and risky for a company.
i) Debt to Equity Ratio :-
This ratio shows the amount of long term debt company is holding for every 1 rupee of equity. Higher D/E ratio is not advisable for a company.
ii) Times interest earned :-
It is a ratio which is calculated by EBIT/ interest.
This ratio shows times capability of a company to pay its interest. Higher the ratio safer the company.
iii) Current Ratio :-
Current ratio is Current Assets/ Current Liabilities of a company. This ratio shows the capability of a company to pay off its current liabilities. Higher the ratio, better for the company.
iv) Quick Ratio :-
This ratio shows the capability of a company to discharge its current liabilities from its liquid asset. This ratio is calculated by (Current Asset – inventories) / current liabilities.
Bear Case – Before investing in an equity stock you should know all the cases or situation which might lead people to sell this stock. An investor should know all the risk which is related to a stock in which he/she wants to invest so that he can be prepared for the worse situation and save himself/herself from losing money in the equity market.
ANALYZING A COMPANY – MANAGEMENT
It is important for investor to analyze a company’s management before investing in it because it is the management which is running the company and responsible for performance in the the stock markets. Analysis of the management can be done through 3 phases :-
1) Compensation :-
It should be checked that whether the management is paid fairly and are not overpaid. This can be done by comparing their pay with their peers.
It is a good sign if a company is paying compensation on the basis of the performance, this will motivate employees to work harder for the company.
2) Character :-
Investor should check the character of management by focusing on the following points –
i) whether the company is doing most of its business with its relative parties?
ii) whether the BOD is stacked with the management’s family members or not?
iii) If the management has made any kind of mistake then does it hidding its mistake or ignoring them.
iv) whether the management is rolling its employees in order to save its salary cost?
3) Running the Business :-
Check whether management is properly running the business or not. Check the trend of ROA and ROE and check whether high roe is not due to increase in the leverage.
Investors need to check whether the increase is revenue if there is, is due to any kind of acquisition. They also need to check whether they are getting paid over their receivables or not.
They also need to check whether the dilution of equity is happening or not.
The investor needs to make sure whether the company is making proper disclosure of material information or not.
AVOIDING FINANCIAL FAKERY
How can an investor avoid financial fakery?
The author has written about few red flags from which an investor should get an idea about it. These red flags are as follows :-
1) If the company’s cashflow from operation is stagnant or decreasing but their net profit is increasing then this means that the company is doing most of its sales on the basis of credit and its not receiving cash from its debtors very soon. This shows the company’s inefficiency at cash collection.
2) If the company is frequently charging its one time charge then it means it is correcting its numbers by them.
3)If the company is doing too much acquisition of those companies which does not have growth and will not impact the company in large then there might be something fishy about it.
4) If the company is frequenly changing its auditors then its a red signal. Resignation of CFO or the auditor due to some accounting issues in the company is not a good signal.
5) If a company is recording capital gains in the revenue and not showing the capital expense then thats a red signal.
6) Its not a good signal if a company has an undervalued pension fund. This could result in lowering of profits of the company as its an obligation for the company to pay to its employees when they retire.
7) If there is alot of unsold inventory with the company then thats not a good signal because this shows the bad estimation of the company regarding the demand for their product and then they would have to sell their unsold inventory at the cheaper rate in order to clear their stock which will ultimately affect their profit margins.
8) Companies can manipulate its liabilities by not recording proper depreciation and provisions for doubtful debt which can impact their profit margins if all their debtors did not pay them. This manipulation does not show the true and fair view of the company.
9) Company can also manipulates its income statements by not recording expenses which needs to ne recorded. Company might assume some expense as capital expense which might not exactly be a capital expenditure and then they write off it which ultimately lower their expenses. So these tricks needs to be kept in mind by an investor before investing in a company with good financials.
VALUATION – THE BASICS
It is very important for an investor to understand the valuation of a company. From that he can know which stocks in the market are overvalued and which are undervalued. With that he/she can earn handsome returns on his/her investments.
As stated earlier by the author, a good investment is not done by investing in a good business at a higher price but investing in a good companies at attractive prices. If you purchase stock of a good company at an attractive price then that will increase your return on investement alot.
There are basically 2 components of return
1) Investment return
2) Speculative return
Investment return happens because of dividend yeild and earning growth
Whereas speculative return comes from change in PE.
Buy buying a good stock at low price will lower down your speculative risk for your investment.
Valuation can be done using the following ratios :-
1) P/S Ratio (price to sales) :-
P/S ratio is nothing but share price of a company divided by its sales. This ratio tells us that how much an investor is ready to pay a company on 1 rupee of its sales. Higher ratio tells us that company is doing good and people trust that conpany. It is necessary that we compare P/S ratio of companies which belongs to the same industry as every industry has different profit margins.
2) P/E Ratio (Price to earning) :-
P/E ratio is share price of a company divided by its EPS(Earning per share). This ratio is very much used by the people while doing valuation of any company. Just like P/S it is preferable to compare P/E of companies in the same industry. Normally it is assumed lower the P/E, better the company as the company is having good earnings and the stock price is low. But an investor should not make decision on the basis of the current P/E. It is preferable to check the historial P/E also. If the company is having stable growth rate with low P/E in past years then it can be said that the company is good for investment as the company is doing good expenditure for its growth and is undervalued also.
There can be other reasons also by which a company’s P/E and inflate or deflate, it is necessary that you eliminate those reasons and then take the P/E into consideration.
Some of the reasons are as follows :-
i) If the company has taken any kind of bigger expense this year which is not normal then that will lower the P/E of the company so that expense needs to be excluded.
ii) If the firm has sold its asset or part of its business then that will lead to decrease in the P/E as the earning would increase for the company. That kind of transaction needs to be excluded from calculations.
Chapter 17: Banks
Bank is one of the most important sectors in every economy because they provide the service of lending money to the businesses. Because the service that bank provide is so vital to long-term economic growth, the banking industry is almost certain to grow in line with the world’s total output. Banking business model is simple.
Business model of bank:
Bank is one of the most important sectors in every economy because they provide the service of lending money to the businesses.
Lend that money to the borrowers.
Banks earn from the spread/ Difference. This means if bank borrows money from depositor at 3% and lends that money at 6% so the difference between both borrowing and lending rate (3%) is bank’s earnings.
Banks are more capital intensive, they need more equity in order to lend more and be profitable. So, in analyzing banks see high equity portion and enough provisions for bad loan.
Now let us understand the different types of risk which a banking industry faces and how they deal/ manage that risk:
Banks deal with major three types of risk:
- Credit risk.
- Liquidity risk.
- Interest rate risk.
Managing Credit risk: Credit risk is a core part of lending business. which can be estimated by analyzing balance sheet, loan categories and NPA (non-performing asset. Banks generally avoid this risk by either diversifying their portfolio, or through collection procedures or by solid underwriting. Big companies in Banking sector follows this process to avoid this risk:
- Portfolio diversity (Not giving major portion of loan to a particular company/ Industry).
- Conservative underwriting and account management.
- Aggressive collections procedures.
Managing Liquidity risk: Credit risk is considered top level risk in banking industry. Banks are being paid for liquidity service. Less intuitive, but equally attractive from a business perspective, is the role that liquidity management plays. Banks have liquidity risk as they take money from depositors and lend it for short-long term, but what if all the depositors want their money back but bank don’t have money as it has lent it, it is call as asset liability mismatch, which is liquidity risk. Banks offer liquidity management services in many forms. Many businesses pay banks a fee to maintain a back up line of credit. There is no other business in the world where you can take money from people and effectively charge them to take it off. This is why it is important to track deposit levels.
Managing Interest rate risk:
Third and one of the main types of risk faced by banks is interest rate risk. The fear investors avoid investing in banks, is that earnings can be squeezed by the interest rates, which are outside the control of banks. If bank is asset sensitive – i.e. interest rate on asset will changes more quickly than rate on liability –, rising rates will be profitable, but if bank is liability sensitive (falling rates will benefit banks), rising rate can create trouble (as interest margins will get lower).
Economic Moats in banks:
- Huge balance sheet requirements: There likely is no industry more capital-intensive than banking, which usually earns directly on their asset; hence, having large asset base is economic moat for banks.
- Large economies of scale.
- Oligopoly Market.
- Switching cost for the customers.
Investors before investing in banks should check ROE & ROA ratios and better the ratio more efficient the bank is. From valuation perspective, one should check P/B ratio and compare with its competitors to know whether the stock is undervalued or not.
Chapter 18- Asset management
Asset management:
Asset managers enjoy huge margins and constant stream of fee income. Asset Management firms run people’s money and demand a small proportion of the asset as a fee in return. It requires a very little capital investment. Compensation is the firms main expense. Asset management companies are most unique ones as they don’t depend on capital to grow. For AMC biggest expense is their employees benefit expense/salary one.
Economic moat/ Competitive advantage for AMC are:
- Diversification
- Asset Stickiness
Asset management accounting 101:
Asset under management is one of the most important metrics in this industry as companies in asset management industry earns X% revenue from AUM only. This is one of the good indicator to track how well the firm is performing.
Key drivers of Asset Management Companies:
AUM is biggest driver of revenue in this industry. Money managers charge higher fee to manage equity portfolio than to manage bonds or other money market fund. As we have seen that AUM increases the revenue for the companies but we also need to check the following:
- AUM is increasing because of which factor/ Component (Equity or Bond).
- AUM can increase due to market movements too but firms/ Investor must not rely on that thing.
Hallmarks of success of Asset Management Companies
- Diversity of product and investors
- Sticky assets
- Market leadership
- Niche market
Software:
Software industry is intensely competitive. Starting a software company is difficult but transferring software is easy. Software companies are also called cash cows. Segments of software industry:
- Operating system: All the program performed by computer are run by operating system. It also handles direction from hardware such as printers.
- Database: This helps computer in collecting data and storing it. Switching costs are high i.e. if anyone wants to move data from one database to another it will be costly. Microsoft, IBM, oracle dominates this market.
- Enterprise Resource Planning (ERP): ERP help businesses by lowering the burden of back-office work, but it didn’t show high growth as many firms already have installed ERP.
- Customer relationship management (CRM): CRM is software which keep track of client data, which creates selling opportunities and improves customer satisfaction.
- Security – With the increase in online data sharing, the data is available not only to employers and customers but also to hackers.
- There are also some segment like Video games, graphic design software etc.
Economic moat:
Due to rapid technological changes and low barriers to entry, wide moats are tough to make in software industry. To assess economic moat in this industry we need to look at following points:
- High switching costs – If firm’s place switching costs high, then customers will not turn towards competitor’s product.
- Network effect – Adobe can be a good example here. Majority of people view file in Adobe Reader. So people try to create documents in acrobat reader only.
- Brand names – Strong brand names can help company increase their sales.
Hallmarks of successful software companies:
- Increasing sales
- Long track record
- Expanding Profit margins
- Large Installed Customer Bases
- Great management.
Hardware:
Factors like product cycles, price competition and technological advances are very intense in the hardware sector. It is very difficult, thus to build sustainable competitive advantage.
What drives the hardware industry?
- Due to technology evolution, cost for developing hardware become low; that is now you can buy more powerful computer at lower rate than earlier.
- The hardware sectors central driver is its ability to innovate.
- The shift of advance economies from manufacturing towards services.
- The relationship between technology hardware and software.
Hardware Industry Dynamics:
- This type of companies are more cyclical in nature as people don’t purchase at bad times.
- Cyclical in nature.
Economic Moats of Hardware:
- High customer switching cost
- Low cost producer
- Intangible Asset
- The Network Effect.
Media:
Many companies in this sector benefit from competitive advantages, such as economies of scale and monopolies, which make it easier to sustain excess profits for long periods of time.Media companies have great opportunity to grow, but picking the correct one is too tough Media is the one which has very broad term, so it is divided into 4 parts:
- Publishing
- Broadcasting and cable
- Cable industry
- Entertainment industry
Risk in Media sector:
- Many media companies are still being controlled by a family, which sometimes can’t make decision in the benefit of shareholders
- Media firms sometimes have cross-ownership holding – i.e. another company has right to contribute in company’s decisions
- Be wary of the firm which reward executives with ridiculous compensation.
Telecom
Telecom one of the toughest industry as it is a capital intensive industry, makes barrier to entry high. It also has non-existence of moat, dependency on regulations and high capital intensity.
Telecom Economics
- Building and maintaining a telecom network is extremely expensive and require lots of capital.
- The emergence of the internet, the opening of local networks to competition and rapid wireless growth allowed new players to grab a piece of the action.
- Competition is too huge in this sector and everyone is competing with one another either in price or in better services.
- Companies have perfect competition and near-zero pricing power
- Companies with huge customer base usually have their hands up, although they can’t increase price due to competition pressure.
Hallmarks of success in Telecom:
- With the high need of capital investments, free cash flows become more important to see in the firm.
- Strong financial health is required for firms to be attractive. A strong balance sheet and solid free cash flows are even more important.
Before investing in Telecom have a huge margin of safety otherwise your portfolio will be ruin in future.
Economic profit analysis
Summary of articles/ Videos
Summary of “How the economic Machine works by Ray Dalio”
“Economy works like a simple machine”.
Ray Dalio
Economy might seem complex but it works in a simple mechanical way. It is made up of simple transactions which are repeated over and over again. There are 3 main force which drive the economy:
- Productivity Growth
- Short term Debt cycle
- Long term debt cycle.
After telling this forces author has started explaining the meaning of transaction. Economy is basically any activity related to goods, services, production and consumption within a country. In simple terms it is the sum of all the transactions. .The total transactions of the economy can be divided into two types:
- Money transaction
- Credit transaction. The total amount of spending drives the economy (money + credit transaction)
Ray Dalio says credit is the main part of the economy and it is less understood. Credit is the most important part because it is the most biggest and volatile part. When borrowers promise to repay and the lender believe them then the credit is created. As soon as credit is created it immediately turns into debt (Asset for lender & liability for borrower). Then the author has explained why credit is so important
Whenever borrowers receives a credit he is able to increase his spending.
Spending drives the economy. As your expense is someone’s income.
So when you spend more then someone earns more.
When someone income arises it makes lenders more willing to lend their money because now that guy is more worthy of credit
A credit rating borrower has two thing:
- Ability to repay.
- Collateral.
As we have seen that increased income allows increased borrowing which allows increased spending and since one person spending is one person’s income this lead to more increased borrowings and so on. This led to economic growth and this is why we have cycles.
2. Short term debt cycles
Productivity matters in long run whereas credit matters more in short run.
This is because the productivity growth doesn’t fluctuate much so it is not big driver of economic swings. But debt is because it allows us to consume more than we produce when we acquire it and it forces us to consume less then we produce when we have to pay it back. Debt swings occour in two big cycles:
- Which takes 5-8 years and other,
- which take 75-100 years.
The economic cycles happen because of the debt cycles. A debt cycle is typically like any other cycle-initially, borrowers spend more (by taking credit) than their income and later, they pay more (repayment of the loan) and thus, reduce their spending. After this the author has given us an example explaining why we need credit: Assume two case where in one economy doesn’t have credit and other economy has. In the economy with no credit, the only way through which spending can be increased is by increasing their income which require them to produce more (more productive then before). But in the economy where credit is available there will be cycles. This cycle is because of the nature of credit. Every time a person takes credit he spends more in that time but in future when he will have to repay it he will spend less. Credit is different from money because in money the transaction is settled immediately but in credit transaction is settled in future. Credit can be good as well as bad depending on its usage. Example – If the credit is used to buy a T.V. it will not generate any return but if it used to buy a tractor, it will help in farming through which you can earn money. Credit leads to short term debt cycle. This is how it works – one person earns, say for example, $100,000 with no debt. He can borrow $10,000. So he can spend a total of $110,000. This $110,000 becomes another person’s income with no debt. He will be able to borrow $11,000. His spending will rise to $121,000 which will later become another person’s income and the cycle goes up. But as the cycle goes up it will need to come down. Over the time as the people will spend more, expansion will be there. As the spending is increased the prices rise too, which we refer as Inflation. In this scenario the central bank increases interest rates. This will lead to fewer borrowings and also cost of existing borrowings will rise. As the borrowing will be lesser and debt payments will be higher, this will lead to lower spending and eventually lower incomes. This again will lead to drop in price and overall economy will face recession. In this scenario, when inflation is not a problem, central bank will decrease the interest rates so that economy pick up again. Overall, when the credit is available easily there is a credit expansion and when credit is not available easily there is a recession. This cycle is managed by central bank (generally by changing interest rates).
3. Long term debt cycle
Now comes in long term debt cycle. At the end of short term debt cycle, growth and debt rises. This is because people spend more rather than paying debt. Even if people have rising debts, lenders lend freely because things are going great. Incomes are rising, spending is rising, asset prices are rising, stock market is rising and overall there is a boom. If this is done in huge volumes it is called as bubble. Rising income and asset values help borrowers remain creditworthy. As this debt burden increases slowly over time, debt repayment grows faster than income. Due to this spending is cut and income for other people decreases which makes them less creditworthy. To pay back the debt, spending is to be cut even further. Economy begins deleveraging. In deleveraging there less income, assets price falls, credit is not available, the stock market crashes. As the income drops and there is a pressure of debt repayment, people are forced to sell their assets. Due to this stock market crashes, real estate market crashes. This appears to be recession but is not.
In recession, central banks changes interest rates to stimulate the borrowing. But in deleveraging the interest rates are almost near to zero or zero only. Four ways through which deleveraging (repayment of debt burdens) can be done are – cut the spending, reduce debt through defaults and restructuring, redistribution of wealth and finally central banks printing new money. But it is not that easy. As the spending is cut, income also stops for other people. Businesses cut cost which leads to removal of employees. As the employees will have no income they won’t be able to repay the loans/debt. This will result in banks unable to pay the depositors and there will be defaults all around. When credit is given both assets and liabilities arises. Lender doesn’t want to see their assets disappearing. So here comes debt restructuring. Debt restructuring means lender gets lesser money or gets money over a longer time or at a lower interest rate (from the rate which was agreed earlier). As the incomes are less and unemployment is seen, government’s source of income i.e. collecting taxes is affected. At the same time government has to spend for those who lost their jobs. Basically, government spend more than they earn. In this case government has to borrow more. But the question is from whom to borrow. Now what government does is that they raise taxes on wealthy people and by this wealth is distributed from “haves” to “have not’s”. Then central bank steps in. Central bank prints more money and buy assets and asset prices starts rising. But this will only help those who have financial assets. So government and central banks cooperate. Central bank buys government bonds which result in inflow of money for government. Then government can buy goods and services and eventually help lending money in the hands of people. If all the factors of deleveraging are done in balanced way then deleveraging can be beautiful. If the deleveraging is done beautifully growth will be slow but debt burden will be reduced. Overall, economy will start to rise again.
At last author has told three things which we need to remember:
- Don’t let debt rise faster than income.
- Don’t let income rise faster than productivity.
- Do all that to raise productivity.
Source/ Link of the video: https://www.youtube.com/watch?v=PHe0bXAIuk0
Article-2
Summary on How to avoid common mistakes and uncommon losses
- Not every time bear market is bad and bull market is good.
- Long term investing is very critical.
- Price vs value case study, people have a mentality that stock with higher price will go down and stock will lower price will go up. That myth was broken by showing an example of stock prices of 2 companies.
- People lost around 34k crores+ in equity markets in last 2 years, most of them lost in retail.
- How to choose a good company?
- Look at its financial statements from annual reports.
- Cashflow is very important for analysis which most of the people doesn’t understand. Operating cashflow tells a lot about a company.
- Have a look at its net profit and interest.
- Check if company has made any pledging or not. If there is a pledging, consider its sold.
- It is preferable to invest in a company in which promotor’s stake is more than 50%.
- Always read MDA and ceo statements in an annual report of a company. It tell us regarding futures operations company might take.
- Consolidated financial statements is better than standalone because we are not buying one stock, we are buying entire business.
- Never judge a company by its dividend payout ratio. If a company is paying dividend but has high debt also and a company is not paying dividend but is reducing its debt and the second company is better than the first one.
- Operating cashflow can be manipulated but it is not sustainable in nature.
- Case study of two infra companies was done which started around same time (company A and company B).
- In the beginning Company A had higher stock price than Company B.
- But as of today, Company B has higher stock price than Company A.
- In the quaterly statements of 8 years of both the companies, it could be seen that comapny A had pledging around 31.58% and company B had 0% pledging.
- In the cashflow statements it could be seen that company A’s CFO was not healthy over the years.
- Analysis on a company can be done by knowing about the directors and independent directors in a company and about how the company has described itself in the annual reports. Too much show off should always rings the bell of an investor.
- A case study was shown on a dairy company who had charged very low depriciation, companies debt was going high every year and its CFO was also negative. Dilution of equity was also increasing. It was doing sales but with it receivables were also increasing every year which means that it might be a hoax sales or the company is not able to collect money which might turn into bad debt. That company is now a NCLT case.
- Company might alter money by the name of acquisition in order to attract investments from FII.
- Everything becomes rosy when peak comes. It is very necessary to research whenever a company announces a big acquisition and a foreign country is involved. Too much hype in news about a company might mislead investors and can end up facing losses.
In the end with a help of a video it was shown that how patiences is so necessary in life. The same goes when you are investing in a equity market
Articles summary
ARTICLE ON SHOULD RBI PRINT MONEY TO REVIVE THE ECONOMY?
Introduction Economy has been badly affected by covid-19.
Because of which government aren’t getting enough income through tax collection.
This has made government to increase custom and exise duty on diesel and petrol but still due to lockdown, the vehicles aren’t moving and because of which state governments aren’t able to collect much taxes. Income not only through taxes but from other sources too have been hit for example stamp duty, vehicle registration, alcohol etc…
But stoppage of inflow of income does not stop the outflow of expense.
Government has to spend for expenditure in order to get the economy going again.
Government can borrow through bonds but too much borrowing has its own consequences. So what should government do? Print the currency???
Nowadays everybody be it economist, analyst or journalist has a view that whenever there are crisis then government should borrow from rbi and then rbi should print money, that would bring money in the economy and thus everything would be fine but the thing is they are saying stuffs by looking at only one side of it.
Lets understand this
1) money is not backed by any commodity. It has value because government has said it. This kind of money is known as fiat money.
2) government cannot become insolvent as it can always print money with the help of central bank whenever it need money.
3)developing countries like India faces problem like tax evassion where people does not pay taxes honestly because majority of our economy is informal. So even if government print currency and infuse it in the economy, it will still not able to collect the amount of tax which it should have collected. In order to be effective it needs to call for real economic reform and cleaning of financial economic system.
4) if the government would print too much currency then it will lead to higher inflation because of too much demand on same goods and services but during the current crisis the demand has hit hard and due to which supply has also been hit. So even if the government will print money and raise demand in the economy, it will not lead to a higher inflation.
5) The RBI has to pay interest on the money(reverse repo rate) it printed as it will get deposited in the bank by those who will get the money.
6) In normal scenario government get money buy issuing bonds to private banks which currently give banks a interest rate of 6%.
In money printing scenario return to banks cut to 3.75%, because of which government gets less dividend from its public sector banks and less taxes from private banks as they earned less profits.
7) printing money would also lead to depreciation of the currency means fall in the value of the indian rupee as too much currency has been created. This will lead to more money and less value of currency.
Foreign investor will sell their investment and demand their money in dollar, hence it will lead to increase in demand for dollar and decrease in demand of Indian rupee.
8) Too much printing will increase the debt on government and will lead to downgrade in rating of India. This will lead foreign investors to leave India and then it will create its own set of problems explained in previous point.
9) Developed countries like USA, UK, Canada, Japan, Europe, Australia have currencies which have global demand and therefore printing money there is not an issue but same case is not with India.
In the end it can be concluded as… It is not the economic decision but the political decision whether to print money or not. It is important for the politician to understand this nuance and decide whether to take the risk or not, it can turn either way good or bad.
Article 2:
ARTICLE ON ALM ( ASSET LIABILITY MANAGEMENT)
- ALM is management of Assets and Liabilities. Asset and liabilities for banks are noting but future cash inflows and outflows.
- In ALM mechanism, assets and liabilities are grouped in a timeslots according to their maturity periods. In simple words, assets in a time slot is to be matched with the liabilities of the corresponding timeslot and then if there is any differences (positive or negative) is known as mismatches.
- ALM guidelines were introduced to avoid huge mismatches in banks.
- Desired maturity profile of incremental asset and liabilities is fixed by ALCO.
- Techniques used for ALM by banks are as follows:-
- Gap analysis – It is basically the analysis of rate sensitive assets and rate sensitive liabilities. These are basically the floating interest Loans or deposits.
- Duration Analysis – analysis is done on how can a duration of an instrument can affect the cashflow with floating interest rates.
Sensitivity – It is related to the maturity profile of portfolio of bonds held by a debt scheme.
3. Scenario Analysis – It is done on various scenarios which might affect the ALM. For example declining interest rates and rising interest rates.
Conclusion – It is very necessary for a bank to have a proper ALM and a proper ALCO for that. That would help them to gain confidence in their shareholders and can survive.
Article 3: https://fs.blog/2013/12/circle-of-competence/

This article explains the concept of circle of competence. The above picture clearly says that we actually know less than we think we do. This is why developing a circle of competence is important. Everyone has expertise or have knowledge in some areas due to study or due to their skill and with that you should made your circle of competence. The size of circle didn’t matter but knowing its boundary matters. While investing, as Buffet says, we don’t necessarily need to understand specialized areas to invest. It is important to define what we know and to stick to those areas. Our circle of competence can be widened slowly overtime.
To invest, we don’t want to learn and know every business, but the one we know we have to stick towards it.
we don’t necessarily need to understand specialized areas to invest. It is important to define what we know and to stick to those areas. Our circle of competence can be widened slowly overtime.
Takeaway:- Most important is to honestly define what we do know and stick to those areas. work to expand that circle but never fool yourself about where it stands today, and never be afraid to say “I don’t know”.
Article-4 https://www.capitalmind.in/2020/02/opm-other-peoples-money/
company is funded by either debt or equity. Both debt and equity come with an cost. We need to pay an interest on debt and for equity shareholder you need to generate the maximum return which you can. This article talks about OPM-Other People’s Money. This source of funding is actually free of cost (OPM). But who would give you money for free? If you are business man then Other People’s Money is provided by your customers and suppliers.
Eicher motors and Infoedge are some of the companies who is having OPM (abundent). Eicher Motors- it manufactures the Royal Enfield brand of motorbikes (bullet, thunderbird etc) and the Eicher brand of trucks and buses. They have been almost unchallenged in the mid-weight motorbike segment and have over 90% market share with almost no advertising but through product placements and associations with macho men. Below here is the chart of advance which this companies receives from customers.

On the other hand, the company pays to its suppliers after 95 days (on an average) of purchase. This means that the company can earn interest for at least 2 months (in order to be conservative) on other people’s money. This interest earned is basically earned on the capital which was obtained free of cost. Because Eicher gets to keep both – the customers’ and suppliers’ moneys, this OPM shows up in the form of negative working capital. (Working capital is the money needed for the day to day operations.
Info-edge: Info-edge operates popular websites like naukri.com, jeevansaathi.com, 99acres.com and has investments in several other companies, most in Zomato. Info-edge acts as a bridge between recruiters and job seekers, who pay the company in advance for its services. Info-edge gets paid more 120 days in advance for its services.
Why as a shareholder OPM matters?
- OPM is free whereas debt and equity are not. Therefore, more OPM means less interest expenses which leads to more profits.
- Presence of OPM in itself proves that the company is special, or why else would Other People give it Money. Just make sure whatever it is that makes the company special isn’t likely to go away anytime soon.

De-coding Return Ratios
Return ratios is one of the most important part of analysis for an investor. These ratios are very important because if not analysed properly then the whole analysis can go wrong. So here in this article we are going to understand 4 main return ratios:
- Return on Equity (ROE)
- Return of capital employed (ROCE).
- Return on invested capital (ROIC), &
- Return on incremental invested capital (ROIIC).
Let us start with the first ratio called Return on equity (ROE):
Return on Equity= Net income (PAT)/ Total equity.
The return generated by the firm on the shareholder’s equity is known as return on equity. This ratio is majorly used for the companies which has major equity component and less debt component. We don’t use this ratio on leveraged companies as taking leverage amplifies ROE because in numerator we are taking earnings of whole company but in denominator we only taking equity capital and are avoiding debt. To understand what factors drives ROE movement now we will see DuPont ROE.
Return on equity (DuPont)
DuPont was an accounting firm that came up with this breakup of ROE. This formula tells us what are the factors that are driving ROE.
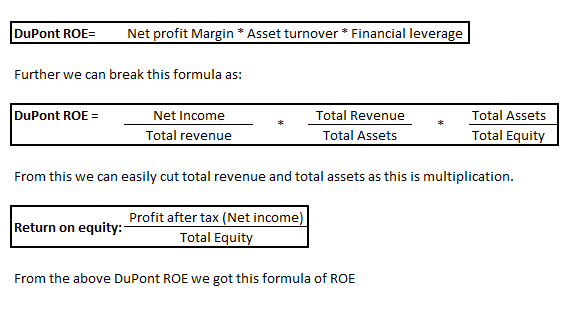
What is the relation between these components and how is it related to ROE?
Asset/Equity (Financial leverage)* Revenue/Asset (Asset turnover)* PAT/Revenue (Net profit margin)
- ASSET/EQUITY = Asset can be bought either by debt or by equity. This ratio shows on how much equity we got our assets.
- REVENUE/ASSET = As we got our assets, those assets will generate revenue for the company. This ratio shows how much revenue will the company generate with the help of their assets.
- PAT/REVENUE = As the company will generate revenue it will also make some margins known as net profit. This ratio shows how much net profit is generated on total revenue.
This activity shows the running of the business. And if we combine all these things together it looks like how much money did we used to buy that asset (Equity). After buying that asset what was the revenue which was generated from that money (Equity) and at last what is our profit margin on that so (this is the long way of calculating return on our money) but if we multiply this ratio Asset and revenue cuts each other so the final formula came out of ROE was PAT/EQUITY.
As stated above increase in any of the three components (1) Net profit margin 2) Asset turnover and 3) Financial leverage) would lead to increase in ROE ratio. Now let us understand when increase in ROE is good for a business by taking examples:
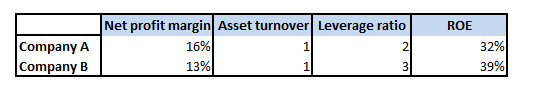
What do you think which company will quote at premium in the market?
Although ROE of Company B is higher but Company A will get more premium than Company B. There is a simple reason why company A would get premium is 1) Net profit margin of company A is higher and 2) Although ROE of Company B is higher but it is because of Leverage ratio. Let us take another example to understand a point what are the mistakes we shouldn’t do when looking at ROE:

So what the main thing to learn here is:
- ROE increasing due to Net profit margin and Asset turnover would get premium in the market.
- Whenever we are looking at ROE then we should look at DuPont ROE because this tells you the source why ROE is increasing.
Limitation of ROE is:
- More the leverage with the company More the ROE of the company because in numerator we are taking earnings of whole company but in denominator we only taking equity capital and avoiding debt. This is why leverage amplifies ROE ratio. To cater this limitation we can use ROCE.
Return on capital employed (ROCE):
The return which the company has generated for all the stakeholders of the company is known as return on capital employed.
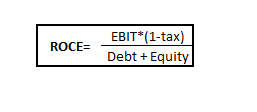
In ROCE we assume our debt as our equity and calculate return accordingly. In this ratio we have taken EBIT*(1- Tax) (Earnings before interest and taxes) in numerator as it doesn’t get affected by company’s capital structure as interest and taxes are yet to be deducted. As we assumed debt component as equity component so we don’t have to pay interest for that but instead of interest we have to pay tax on that portion. This is why we have taken EBIT*(1- Tax) in numerator. In denominator we have taken Total capital of the company which is debt + Equity. Debt= Long term debt + Short term debt + Current portion of long term debt and Equity= Share capital + Reserves and surplus. We have taken Total capital to remove the effect of leverage. This ratio shows the return on the total capital which got invested in the company no matter in what form (debt or equity). Along with this ROCE use Cash ROCE formula which tells you how much return your company made on cash basis so by comparing Cash ROCE with ROCE ratio you can understand that how much your company is earning on cash basis:

This ratio (ROCE) although removes effect of leverage but there is a built-in assumption here which is every penny invested in company is used to generate operating revenue which contributes to PAT. But this is not always true as there might be presence of Non-operating investment and Non operating revenue in the company. So to remove this limitation there is another ratio named Return on invested capital (ROIC).
Return on Invested capital (ROIC):
This ratio tells you “how much return your core-business has generated”. ROCE is total return (Business + Investment) of the firm. So in this ratio we have to deduct Return generated through investment and the capital employed other than core business activities. This ratio is improvisation of ROCE as this ratio shows you the actual return of your business and main thing things is there in no impact of leverage in this ratio too.
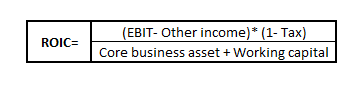
We have deducted all the non-operating revenue and investment from the formula (revenue from Numerator and Investment from denominator as that doesn’t helps in generating operating income). Working capital= Debtors + Inventory – Advances from customers – payables. Core assets will vary as per industry.
When to use this Ratio?
This ratio tells you the actual return generated from the core activities. In this ratio we don’t include investment although company is earning from that because the main business of that company is not to make investment and make return from securities. It’s main job is to manufacture goods (if manufacturing company). ROCE and ROIC can differ due to investments. ROIC might come higher than ROCE in case company has made loss in investment so it’s better to view both the ratio.
Return on Incremental Invested Capital (ROIIC):
Returns generated from the incremental/ additional capital from the business. Company can invest additional capital in the same line of business in which it operates or company can invest that capital in different segment all together depends on the company.
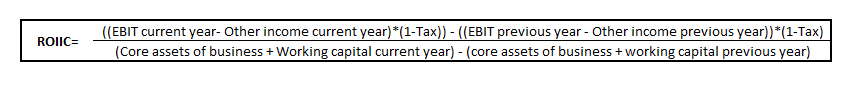
There is one limitation of ROIC which is it doesn’t show the trend it always shows you the final result which means:

In the above image you can see average of both companies are coming same but are they actually same? The clear answer is no so by using ROIIC you get to know the return generated by the incremental capital invested. In initial years ROIC of that firm will come down because the new plant wouldn’t have been operating at maximum capacity. Now let’s imagine company has moved to different segment instead of investing in current segment then what will happen? Now for this type of company it’s very important to find ROIIC because if that company has gone in a segment which has return lower than their current ROIC then Company’s ROIC will fall in the coming years.
Main difference to Remember in ROIIC is timing of CAPEX V/s Wrong allocation of capital:
This means you need to know what factor is driving that number for example Company A did CAPEX into new segment in 2019 by setting up the factory. That plant wouldn’t be contributing in revenue till now (due to COVID-19) so that’s called wrong timing not wrong CAPEX.
Conclusion:
- Each ratio has it’s own utility and importance.
- ROE doesn’t take into account leverage. That’s why ROCE is improvised version of it which removes the effect of leverage.
- ROCE removes leverage but it has a built-in assumption that each penny is invested in operating assets and contributes to operating income. So we use ROIC instead of ROCE.
- ROIC removes both the above limitation which ROE and ROCE has and is improvised version of ROCE.
- ROIIC tells you the return on the incremental capital you invest which which ROIC doesn’t tell you.
- Every ratio is as important but we should know that which ratio is used when and what are it’s limitations so that we can make sense out of numbers.
PFA excel file in which we have done this ratio analysis of specialty chemical companies.

How to analyze price to earnings ratio (P/E)?
Price to earnings ratio is one of the most useful ratio for an investor/ Analyst. It gives us an idea of what the market is willing to pay for company’s earnings. It also indicates how the stock is valued in the market.
How to interpret this ratio?
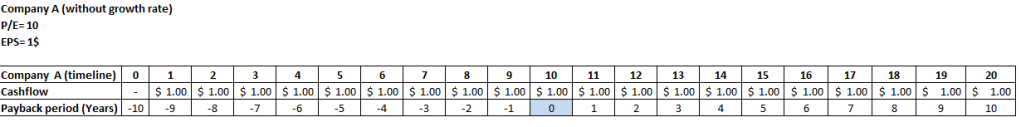
First of all we cannot generalize by saying that a P/E of 50 or 100 is expensive or a P/E of 10 or 5 is cheap. It totally depends upon the growth whether that P/E is expensive or cheap.Without growth rate it’s meaning less to see this ratio. Now let us see why P/E ratio is useless without growth:
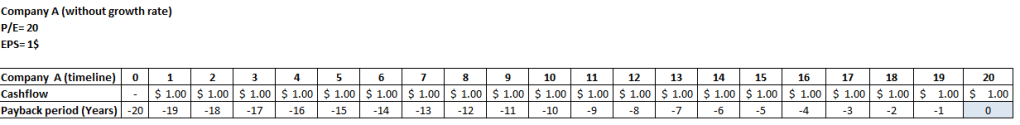
In this above example (hypothetical) we have assumed that company will earn 1$ for coming years. The P/E ratio of the company and the payback period of the above example is same because we have excluded growth factor. A business is always done so that it can grow and bring in more profits for the coming years. So this is the reason why we should take growth into account. So after knowing the reason why we need to take growth as an factor to analyze P/E so what is the reason why people say that buy low P/E? let’s take another example in which we have same scenario as above but this time the P/E is 10 instead of 20 then what will happen?
“Remember one thing P/E ratio always affects your payback period”. Look at the above examples by reducing P/E ratio the payback period also decreased. In this scenario (P/E=10) our payback period has reduced (10 years) compared to P/E of 20. Likewise if you reduce P/E more, then payback period will also decrease that’s why everyone in the market says buy at low P/E. But is it correct?
So far we have seen two main things:
- P/E should be always compare with growth.
- P/E ratio affects your payback period.
Now as we have learnt the base (2 point explained above) now let us go deep into it and understand both the points from one example to get a better/ holistic idea how this both points functions. Lets take an example:


So with growth you can tell that company (with 5% growth and 20’s P/E) is bad and company with 20% growth and 20’s P/E is good. Conclusion: 1) we always need growth with P/E.
You can’t buy stock at any P/E with any growth rate otherwise you can end up paying much more than it is actually worth. For an investor purchase price is everything because returns depends on it. Now let us create scenarios/ example of 3 three companies and understand why purchase price matters:

So in the above example we took 4 companies everyone with different growth rates. “Note: I have deliberately kept P/E of 3 companies same for explaining better”. So if we see above example then we can rank companies accordingly according to their payback period like: 1) Company D 2) Company C 3) Company B and at last Company A right. Have you noticed one thing from the above example that Company D despite having P/E of 100 is a lucrative investment compare to company A & company B. Conclusion: 1) You can’t buy stock at any P/E with any growth rate. 2) Overvalued and undervalued are decided upon growth factor. (Note: Above example is Hypothetical it’s practically impossible to grow double every year).
As explained above “P/E ratio is useless without growth rate” this theory is supported by PEG ratio (P/E divided by Growth). What does the PEG ratio tells us let’s understand:
PEG is Price to Earning Ratio adjusted for growth. For 1% more growth in the company how much more P/E market is giving to that company. PEG ratio: Lower the better as it reduces the payback period. As we saw above lower the better (PEG ratio) concept let us create a new example of two companies having same PEG ratios and compare why the payback period of both the companies are different.
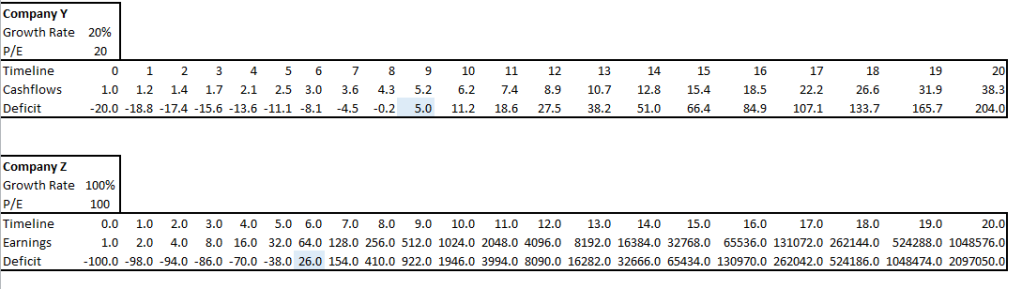

In the above example PEG ratio of both the companies are same but due to one company is having more P/E and more growth (absolute terms) that’s why payback period of both the companies are different. In above example you will see that company Z is a good opportunity to buy but think for a second and analyze that growing 100% every year is not practically possible you might grow for 1 year or for 2 years then your business will come down (growth % wise) so whenever you make an decision opt for a stable business with a healthy growth rate like company Y.
Conclusion:
- While analyzing P/E ratio make sure you take growth into consideration.
- P/E ratio affects payback period.
- Invest in a company which justifies it’s P/E by it’s growth rate,
- We don’t buy stocks at low P/E rather we buy stocks at low PE/g.

What is buyback of shares and how one can make profit from that
What is buyback and why does a company buyback its own shares?
- In simple words, whenever a company buys its own shares from its shareholders either at the existing CMP or higher than CMP then it is called buyback of shares.
Buyback of shares can be done by a company through either of the two routes :-
- Open Market Route
- Tender Route
– In Open Market route the company purchases its shares from the open market(stock exchange) at the CMP.
– In tender route company purchases its own shares by issuing a tender to its existing shareholders. In tender route the buyback price is normally high from the CMP because the company wants to make their shareholder believes that the company’s worth is a lot more than the current market value.
- Most of the times whenever the company buyback its own shares it is because they have excess cash with them. So with this excess cash a company can either give their shareholders dividend or they do buyback of shares.
- There are a lot of benefits of buyback to the company, some of them are as follows :-
- Buybacks are tax efficient for the company.
- Buyback of shares increases the EPS(earning per share) of the company as their total equity gets reduced after the buyback.
- Ownership of the existing shareholders increases.
- Buyback increases the market price of the company.
How will a shareholder or any person would know that a company is doing a buyback?
- You can check on the BSE website and go to corporate announcements and check all the announcements done by any company. So from there you can check which company is doing a buyback.
- We have shared the link of the buyback announcement of three companies on which we have done our buyback analysis, so you can check that announcement of the respective companies in our excel sheet.
Our Work
- We have done buyback analysis on 3 companies – Just dial, Thomas cook and Sun Pharma.
- Buyback is profitable though people many times don’t do it because it’s a complex process and not everybody has a knowledge on how to make profit through buyback.
- We have tried to explain how one can make profit from buyback through our buyback analysis.
